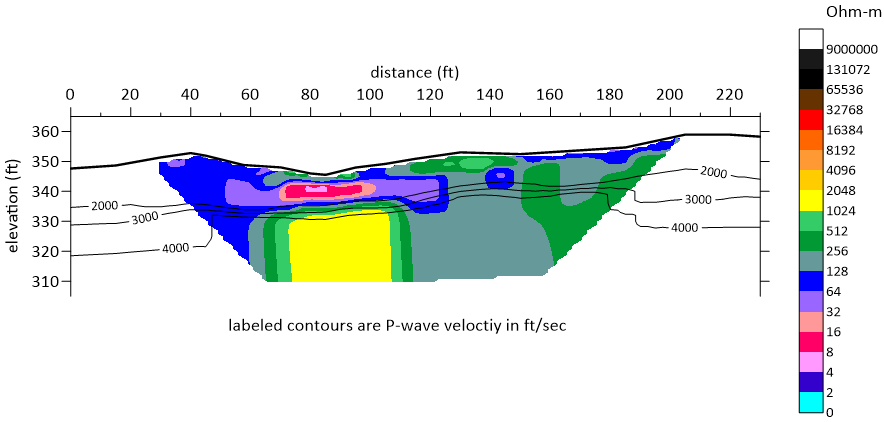
This diagram shows an electrical resistivity model, with the color scale at right in Ohm-meters, and contoured P-wave velocity contours in feet/second (from seismic refraction) overlain. Note that the P-wave contours do not show significant evidence of karst development, but the tightly spaced contours correlate fairly well to very well with modeled resistivity contours representing a transition from overburden to competent rock. Low resistivity areas may indicate karst development. This data was acquired in Maryland.